Historical research published November 13, 2026, at 09:37 (UTC+8). Figures and events below reflect the dates reported in the original article.
Maple’s third-quarter revenue rose even as deposits fell. The key valuation question is how much of that revenue came from greater lending activity—and how much came from charging depositors more.
Fee income drove the increase
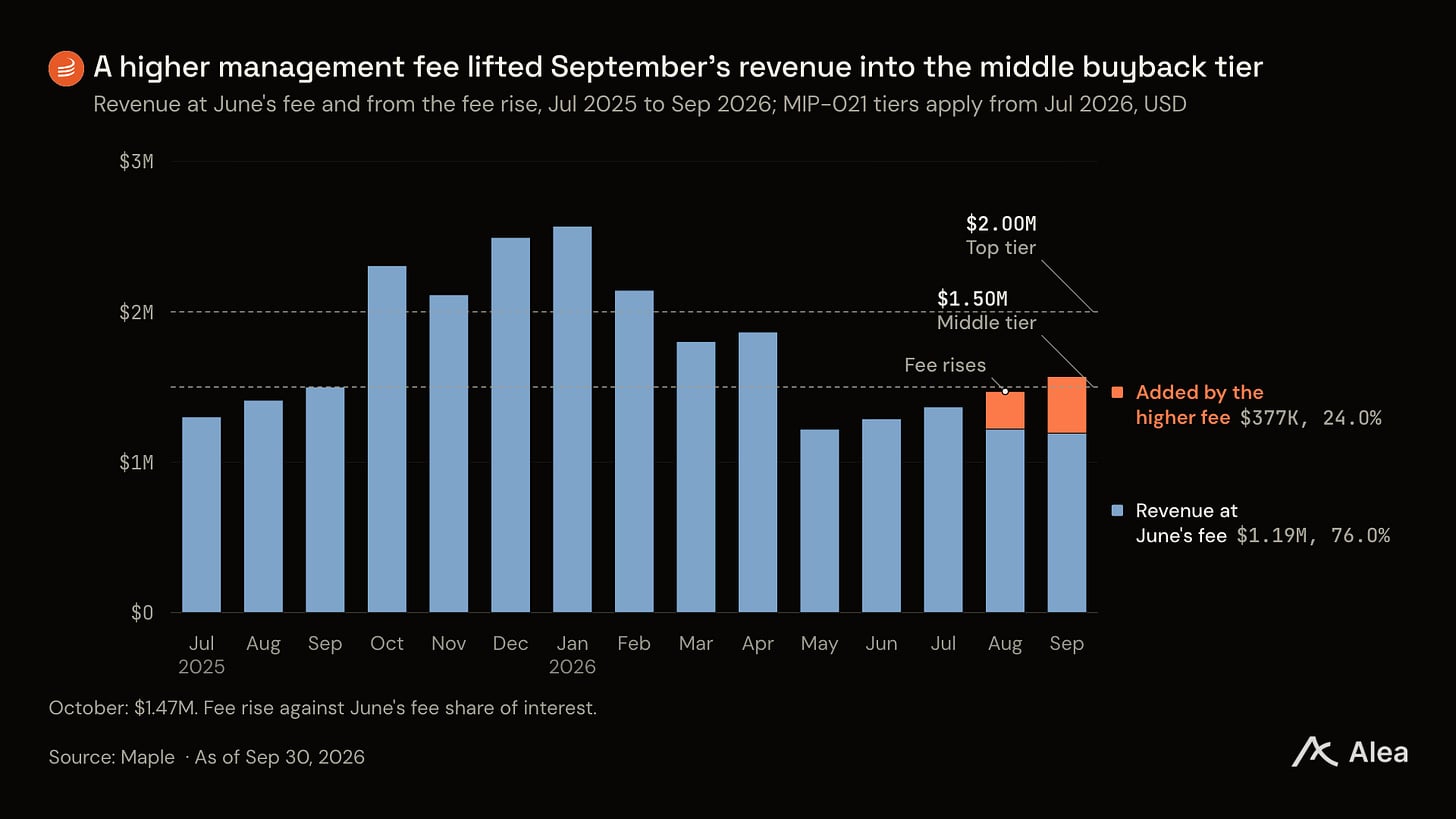
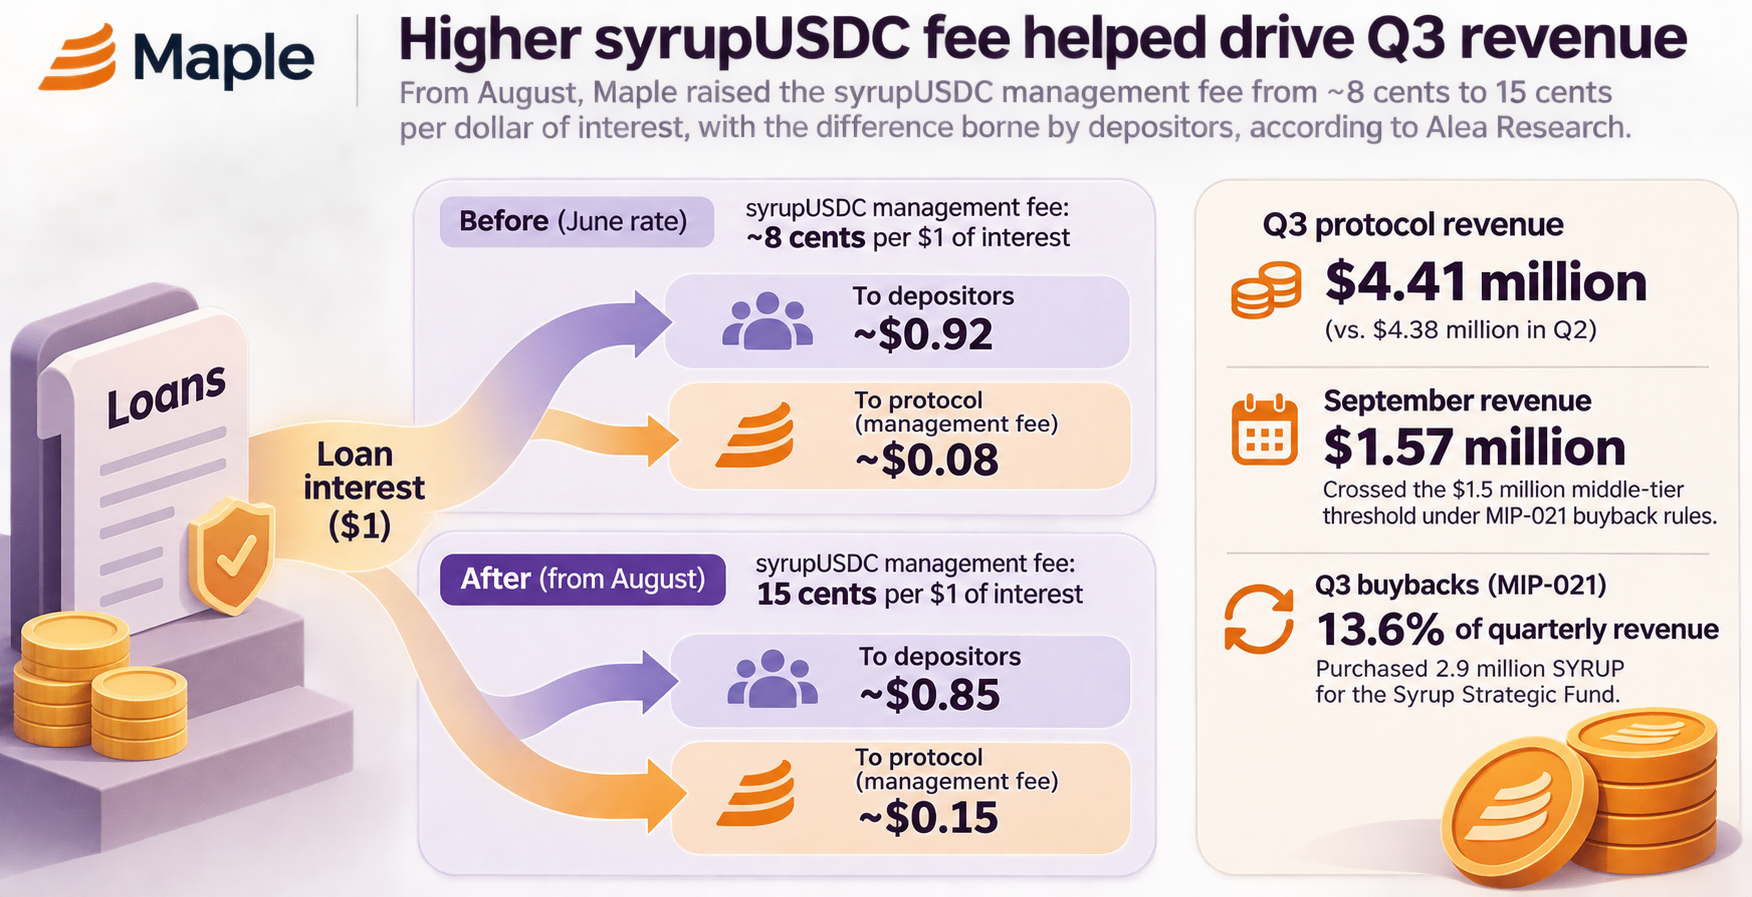
According to Alea Research, as translated by TechFlow, Maple generated $4.41 million in protocol revenue in Q3 2026, compared with $4.38 million in Q2. Monthly revenue reached $1.57 million in September, crossing the $1.5 million middle-tier threshold under the MIP-021 SYRUP buyback rules.
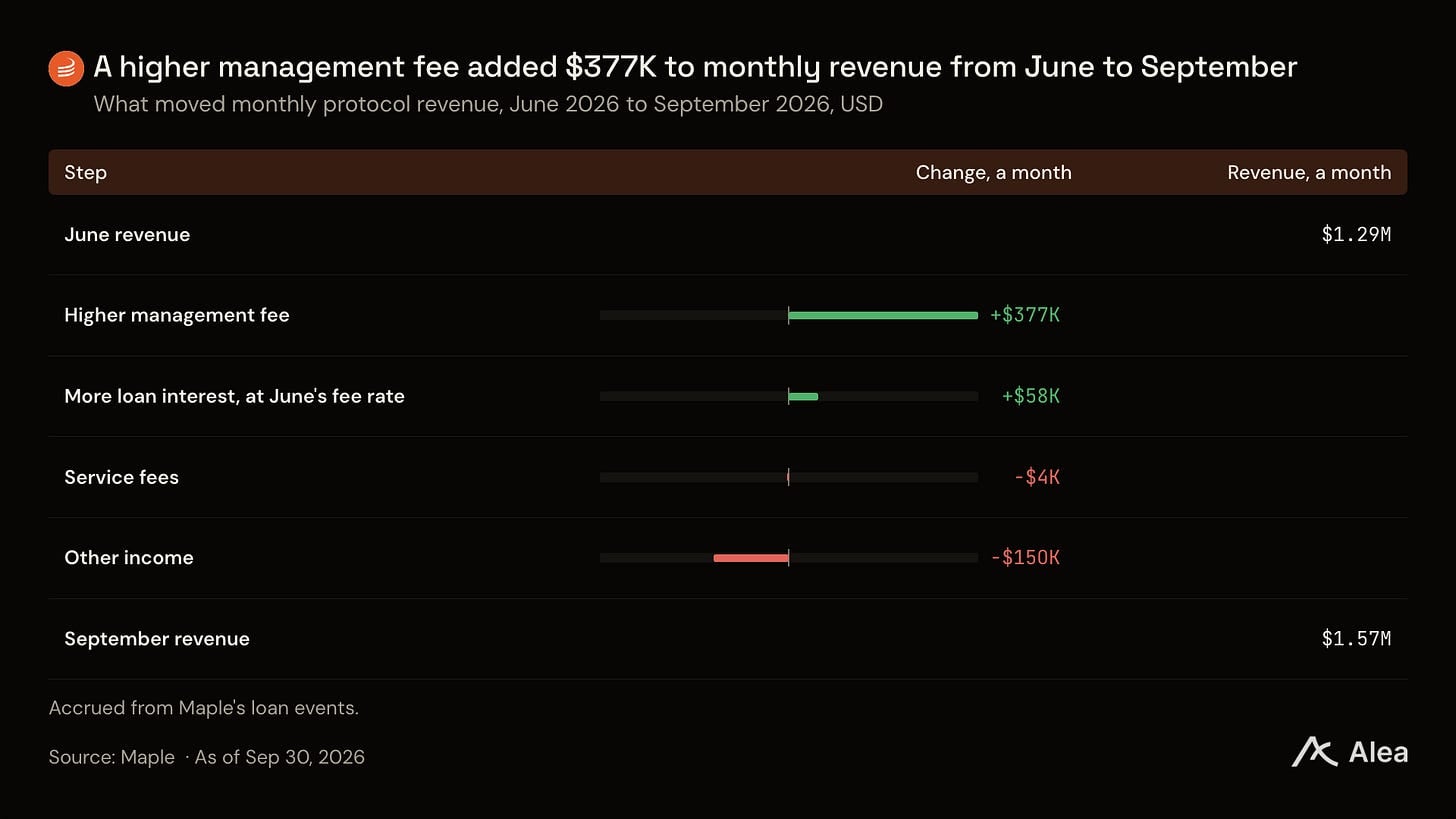
Beginning in August, Maple raised the syrupUSDC management fee from roughly 8 cents to 15 cents per dollar of interest as loans entered their next interest-payment cycle. The difference was borne by depositors. Alea Research estimated that September revenue would have been about $1.19 million at June’s fee rate—below the middle-tier threshold. Across June to September, it attributed $377,000 of additional monthly revenue to the higher fee and $58,000 to increased loan interest.
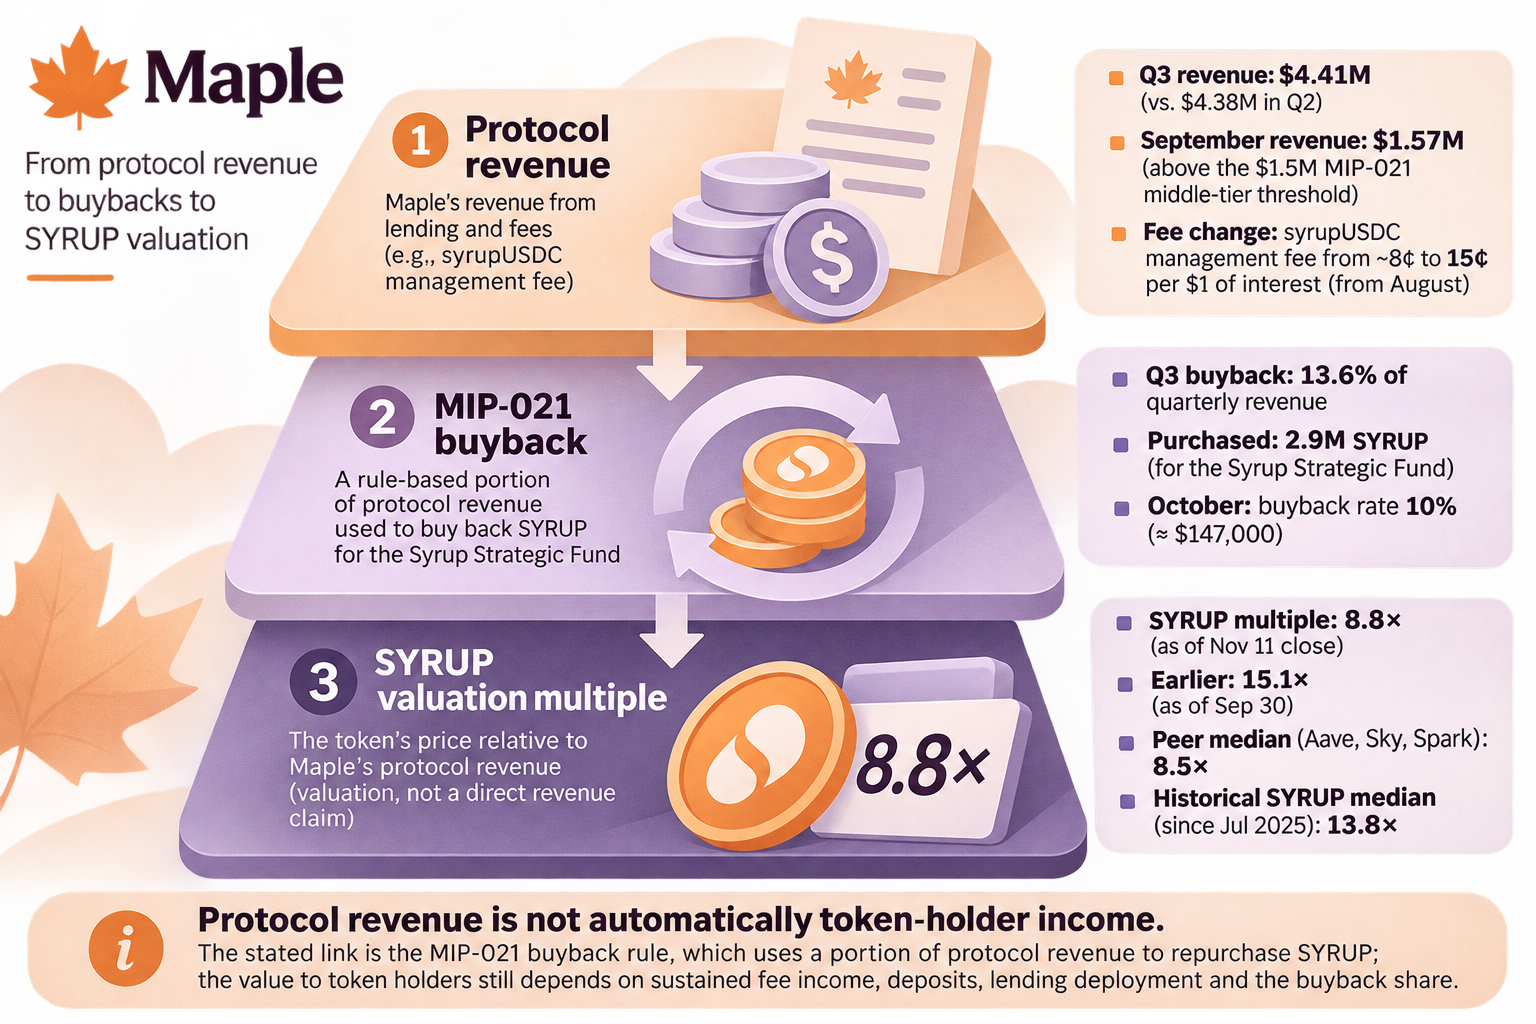
October revenue slipped to $1.47 million, putting that month’s buyback rate back at 10%, or approximately $147,000. Under MIP-021, Q3 buybacks amounted to 13.6% of quarterly revenue and purchased 2.9 million SYRUP for the Syrup Strategic Fund. Protocol revenue is not, by itself, revenue paid to token holders; the buyback rule is the stated link between the two.
Deposits and lending did not move together
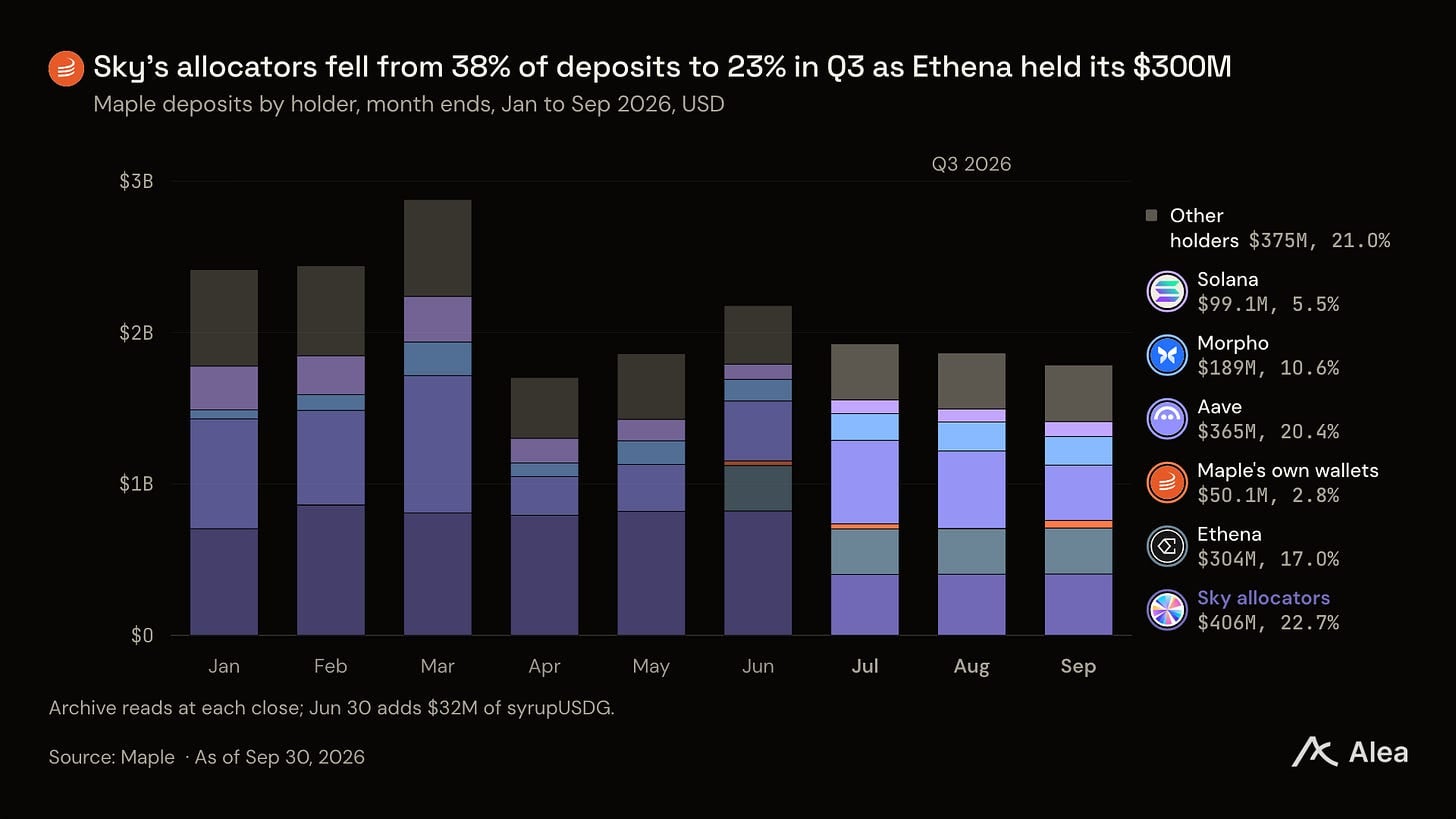
Total deposits fell 17% in Q3, partly as two Sky allocators withdrew about $422 million and leveraged syrupUSDT funds left Plasma. At the same time, syrupUSDG attracted $176 million in deposits during its first quarter after launching July 1. Maple had $1.67 billion in outstanding loans on September 30, according to the report.
More of the remaining deposits were deployed into loans. Alea Research put loans at 93% of average deposits in September and annualized revenue per dollar of deposits at 1.04%, versus 0.92% in October. Those figures describe Maple’s revenue generation, not a depositor yield or a return accruing directly to SYRUP holders.
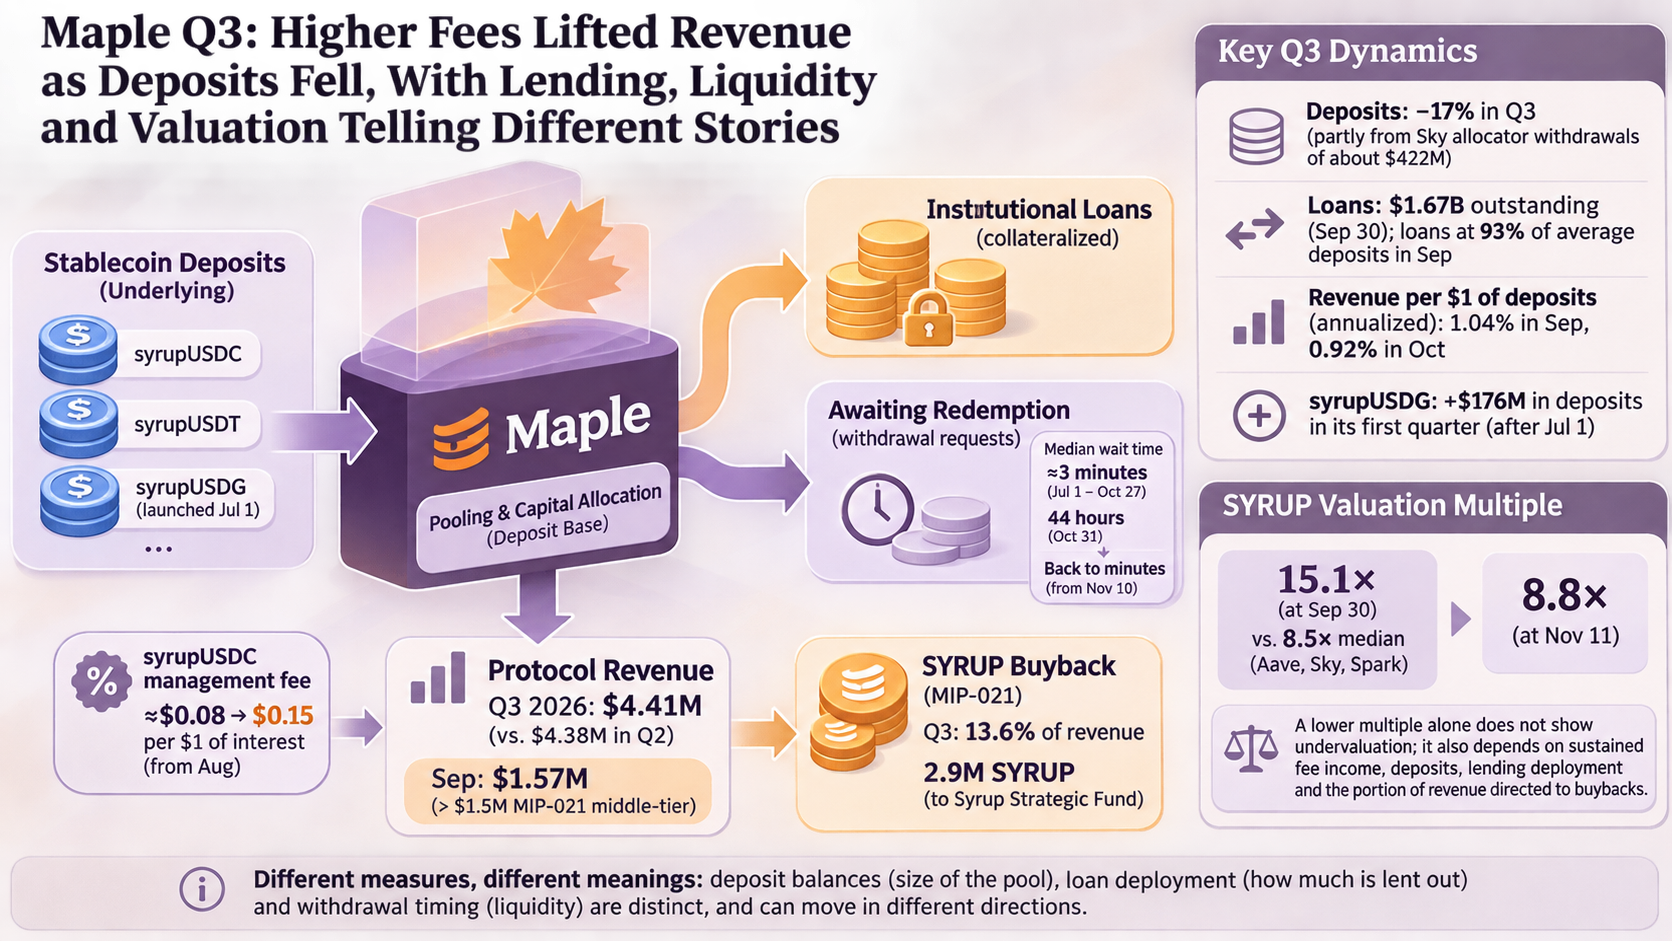
Liquidity also matters when interpreting deposit growth. The report said the median wait for syrupUSDC redemption requests submitted October 31 was 44 hours, versus about three minutes from July 1 through October 27. It reported that requests were again clearing within minutes from November 10.
What the SYRUP multiple assumes
At September 30 prices, Alea Research valued SYRUP at 15.1 times annualized Q3 protocol revenue, against an 8.5-times median for Aave, Sky and Spark. After a price decline, the SYRUP multiple was 8.8 times at the November 11 close. A lower multiple alone does not establish that the token was undervalued: the comparison depends on sustained fee income, deposits, lending deployment and the portion of revenue ultimately directed to buybacks.
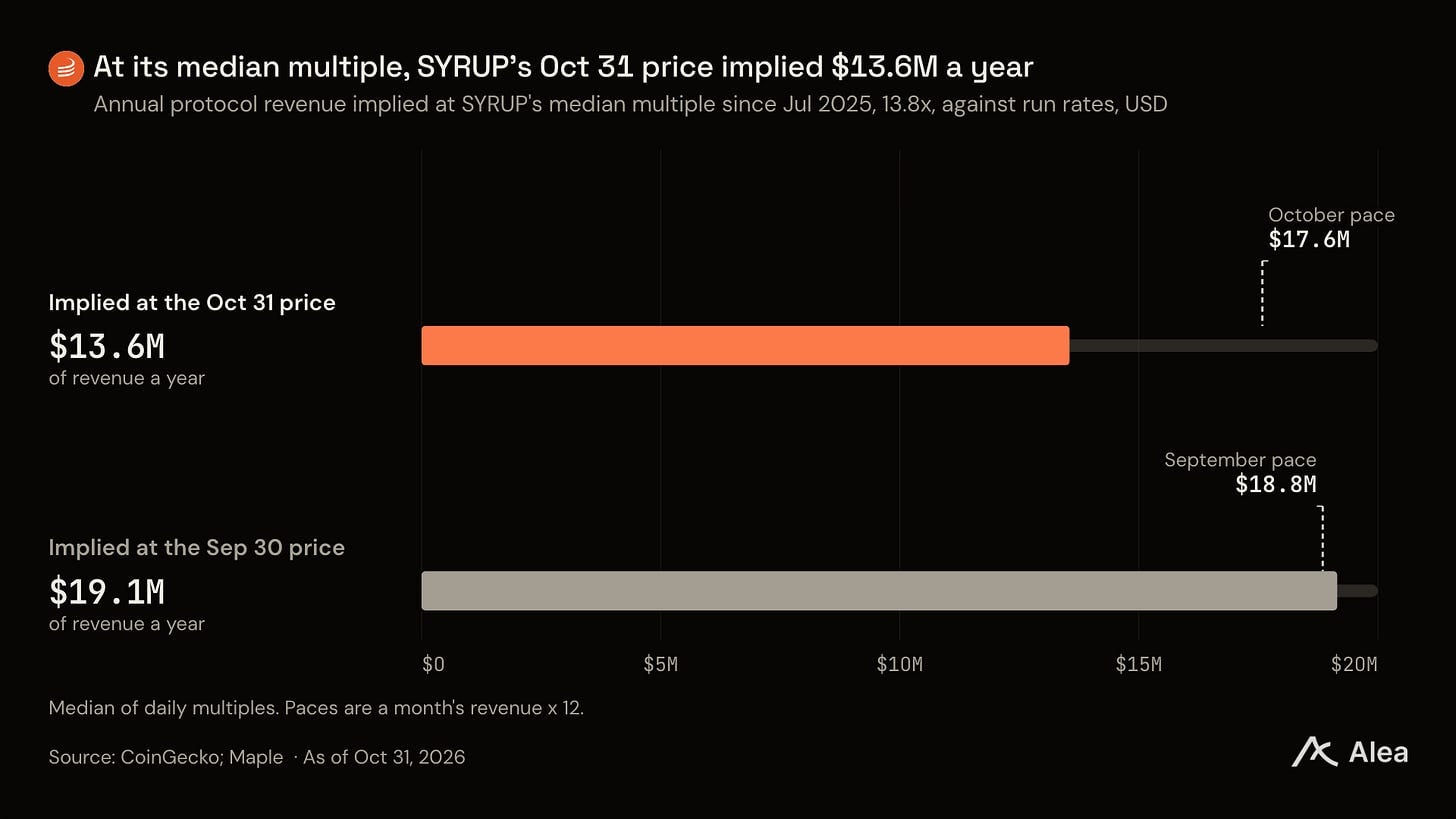
Using SYRUP’s 13.8-times median multiple since July 2025, the report calculated that its October 31 price implied $13.6 million in annual revenue. Annualizing Q3’s reported revenue instead gave approximately $17.6 million. That gap is a comparison of a historical pricing assumption with a recent revenue run rate—not a forecast that either figure will persist.