
Originally published by PANews on November 13, 2026, at 16:40 (UTC+8). Figures below reflect that report’s timeframe, not current market conditions.
Bitcoin’s selloff raised a valuation question: was the price decline evidence of a change in underlying value, or was thin liquidity amplifying forced selling? The reported measures speak more directly to market positioning than to a fundamental valuation.
Liquidity and positioning
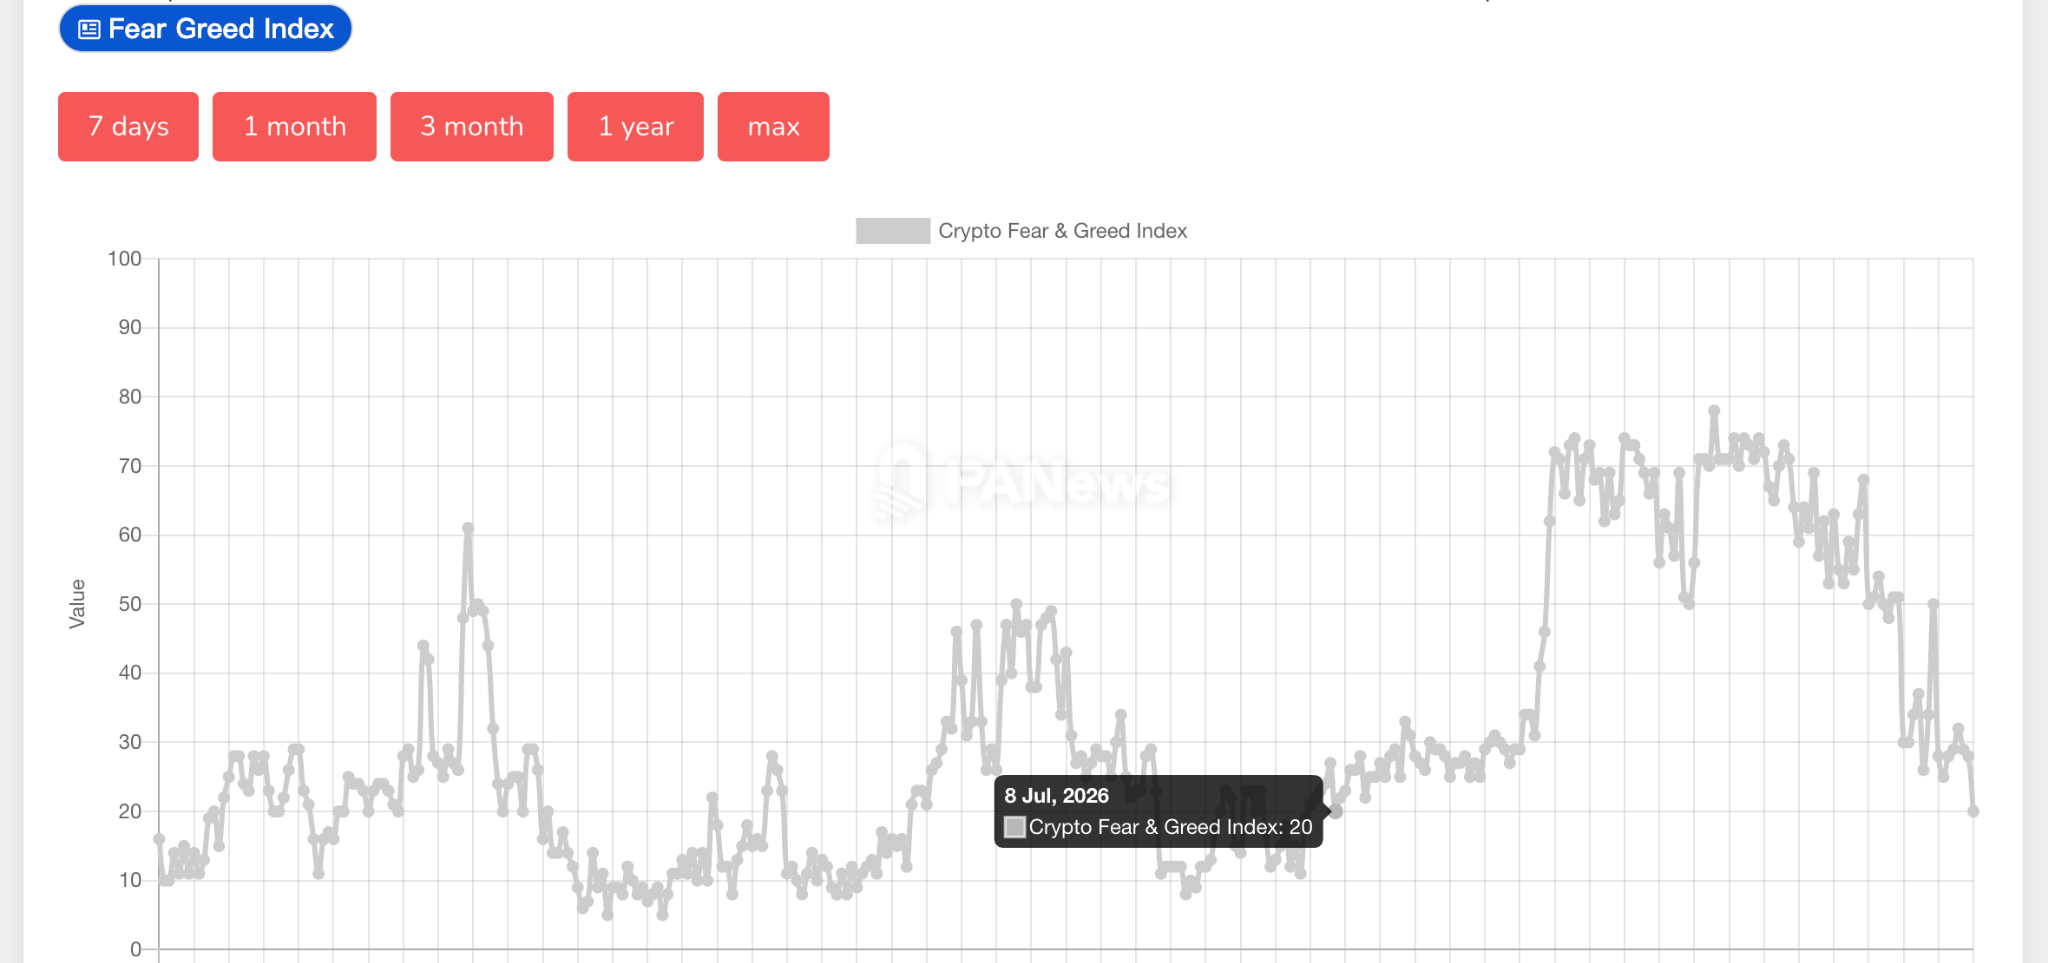
PANews reported that Bitcoin lost the $72,000 and $70,000 levels over 48 hours, briefly traded below $68,000 and was down 9.2% for the week. The wider crypto market lost nearly $200 billion in market capitalization. The Fear & Greed Index stood at 20, in its “extreme fear” range, while Glassnode’s market-compass composite score fell to 11, which the report described as an extreme risk-off reading.
The evidence for weaker buying capacity was more specific. According to Talos research cited by PANews, order-book depth on major exchanges fell 33% to $72 million. The Coinbase premium reached its most negative level since February, and BlackRock’s IBIT recorded more than $2 billion in net outflows across nine trading days. These are different measures—available exchange liquidity, a price premium and fund flows—not interchangeable estimates of demand or Bitcoin’s value. PANews also reported a $300 million net outflow from U.S. spot Bitcoin ETFs on the day preceding publication.
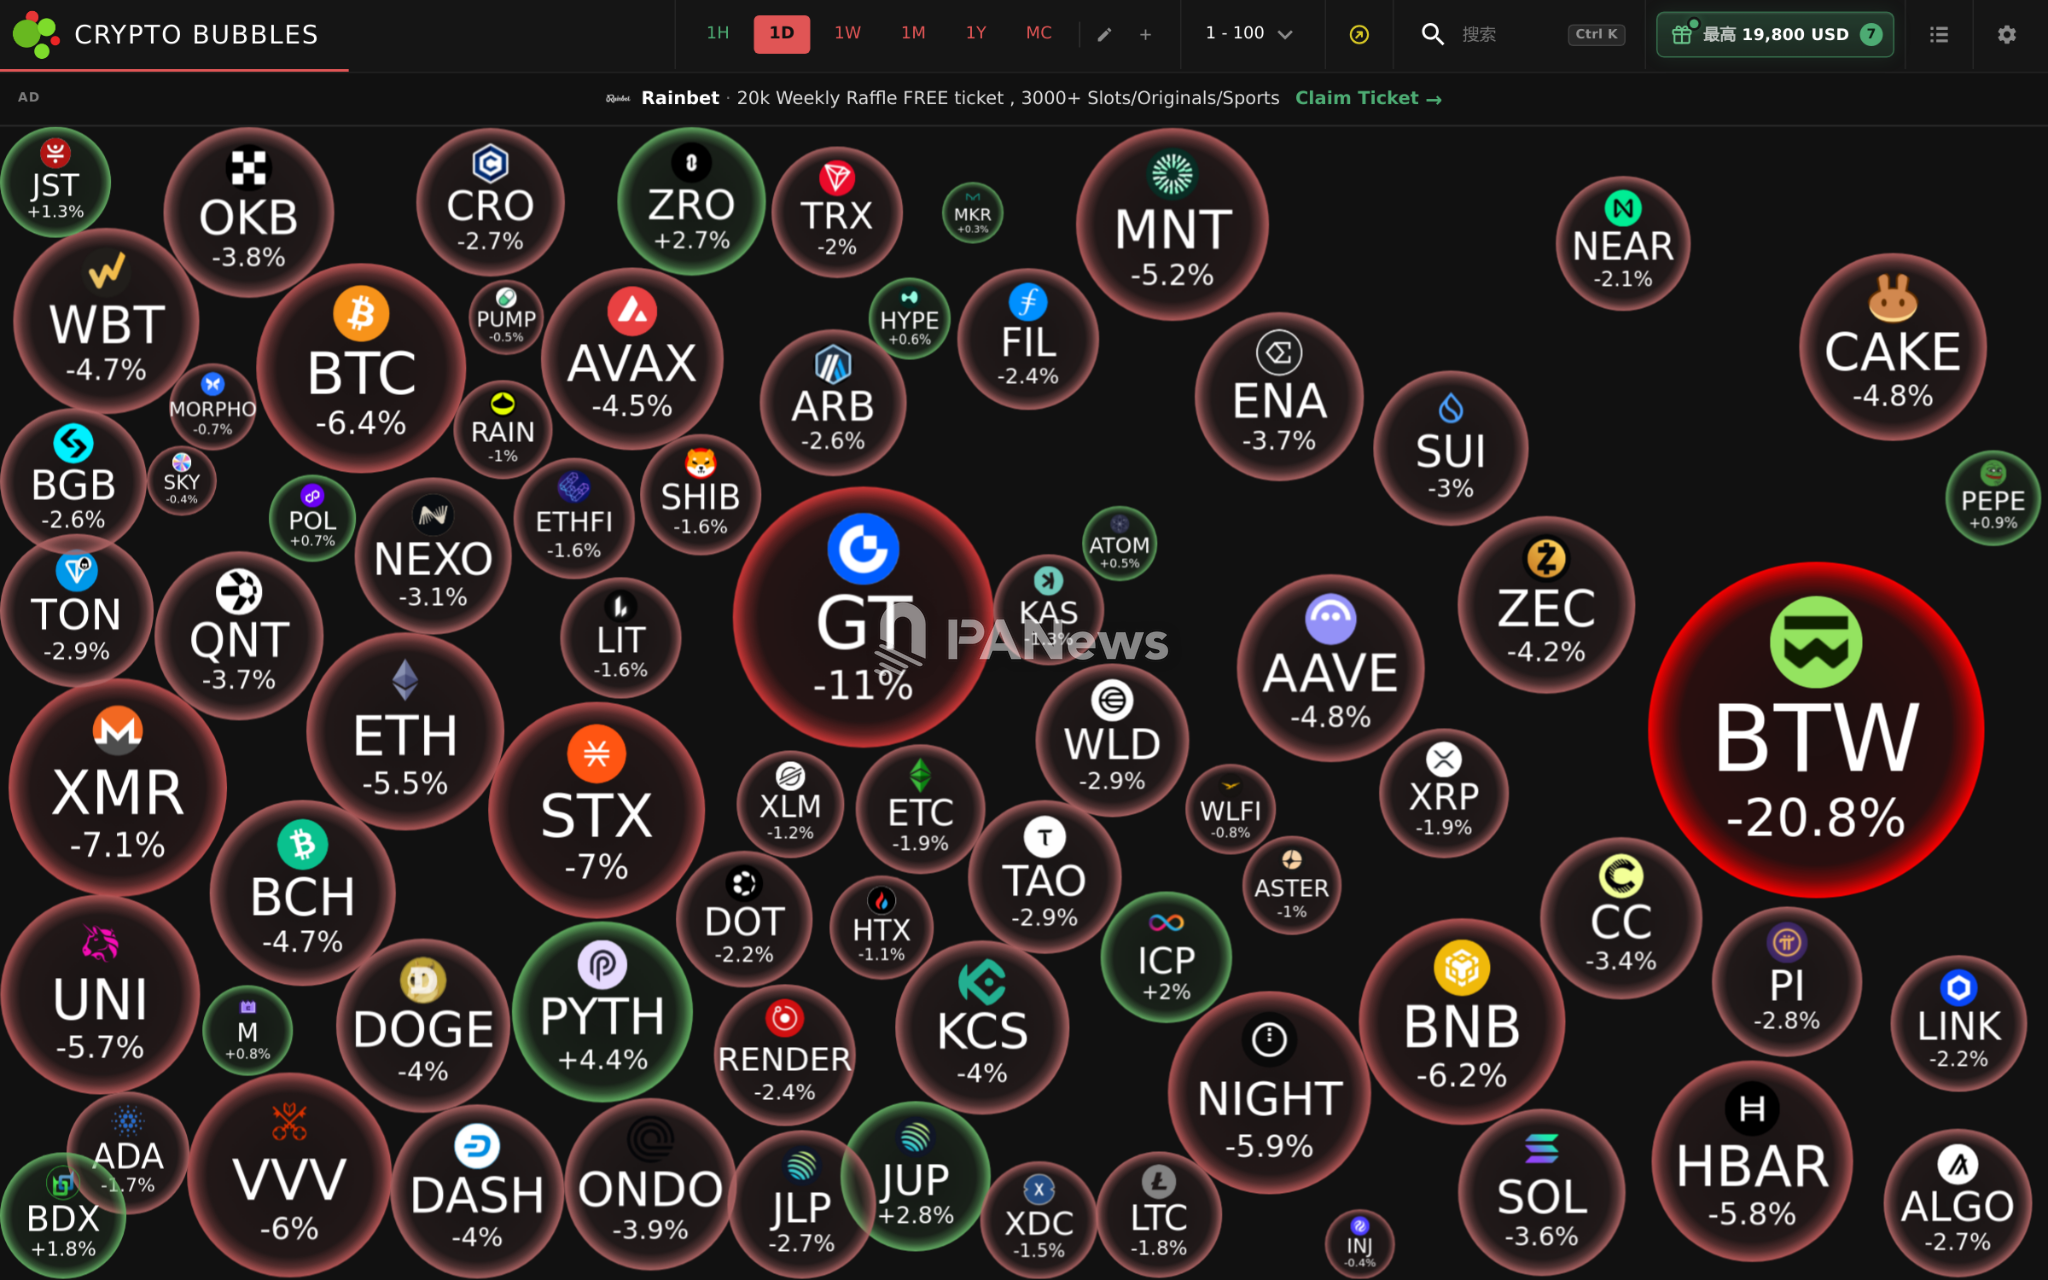
Ardi’s historical comparison put the weekly decline in context: in its review of the preceding 15 years, Bitcoin had recorded a six-week losing streak once in 2014 and once in 2022, but twice in 2026. That pattern describes price history; it does not establish where a floor lies.
Losses and potential liquidation pressure
Mlm Onchain reported that 95% of Bitcoin long positions on Hyperliquid were deeply underwater, with 24,900 wallets carrying $130 million in unrealized losses and an average entry price of $75,565. Those figures describe the reported Hyperliquid positions, not all Bitcoin holders. Separately, Checkonchain analyst James Check said realized losses exceeded $680 million in one day as buyers who had entered above $80,000 sold.

The $67,000–$69,000 area drew traders’ attention because it encompassed the 2021 bull-market high and a reported 200-week moving average near $67,800. Trader Rounder also identified a historical-cycle “power-law floor” near $68,000. That floor is a modeled lower boundary of a long-term price channel, not a guaranteed support level or an independently measured fair value. PANews said Bitcoin briefly fell below $68,000; its text does not establish that it crossed below the stated $67,800 moving average.
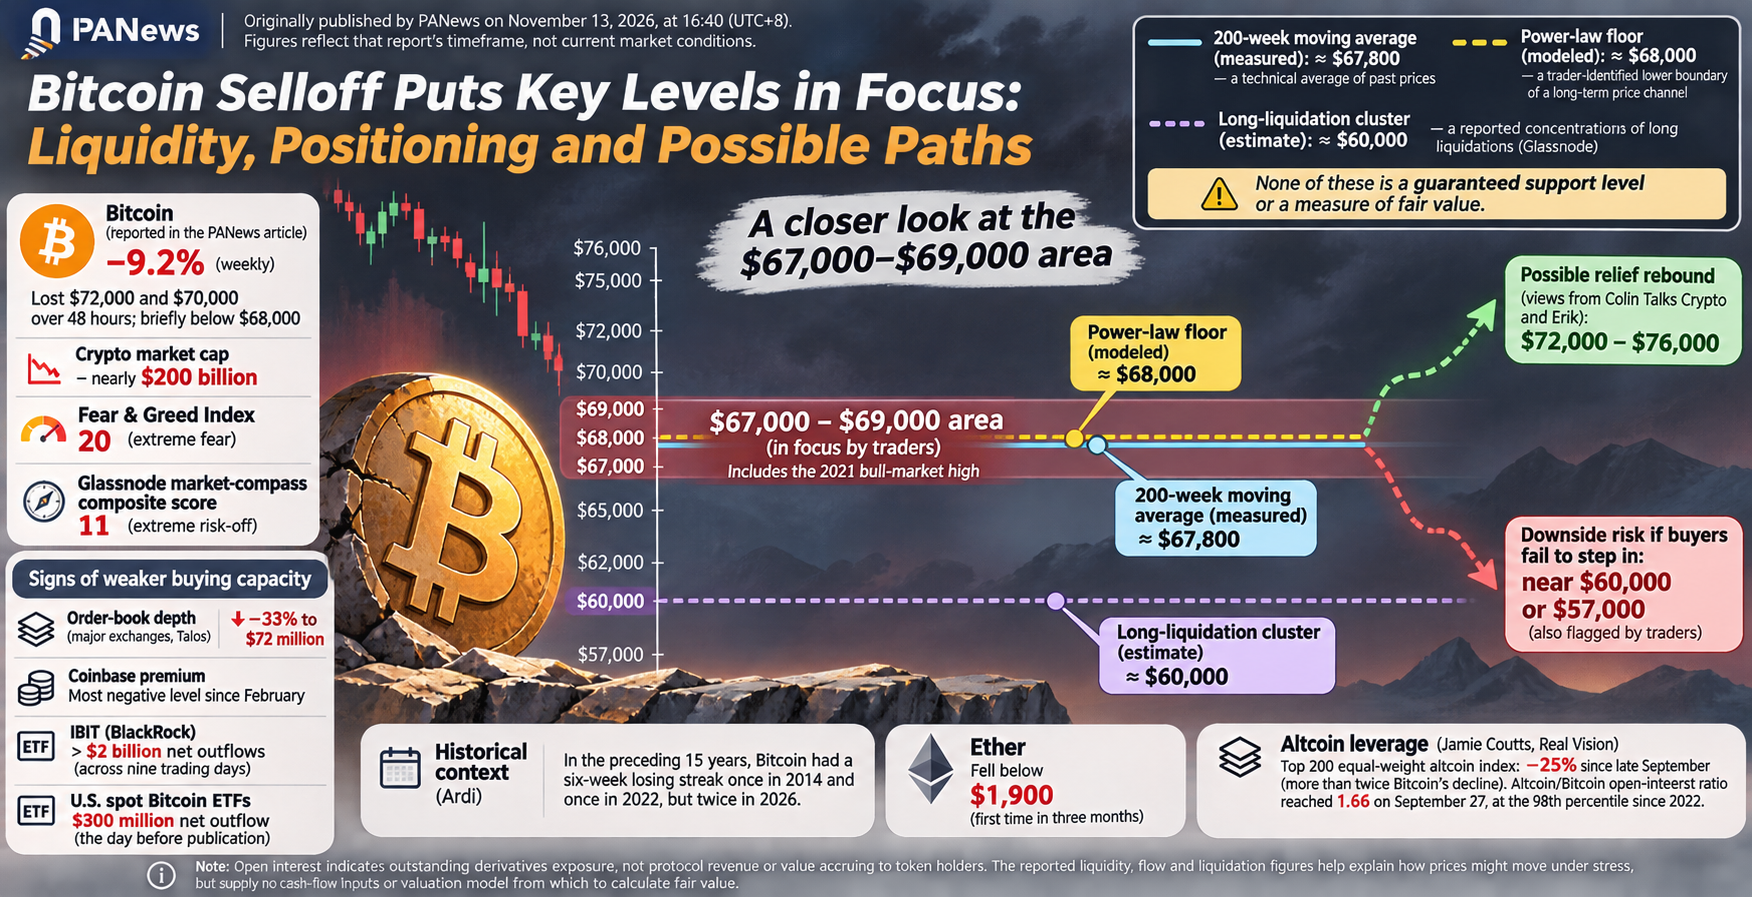
Outcomes remained contested. Colin Talks Crypto and Erik saw scope for a relief rebound toward $72,000–$76,000. A CoinAnk liquidation map showed a reported $1.75 billion concentration of short liquidations above $68,500 and up to $75,000, which could intensify a rise if triggered; it does not predict that one will occur. Other traders warned that failure to attract buyers could bring the February low near $60,000 or $57,000 into view. Glassnode identified a large cluster of long liquidations near $60,000.
Altcoin leverage is a separate signal
Ether fell below $1,900 for the first time in three months. The Top 200 equal-weight altcoin index had declined 25% since late September—more than twice Bitcoin’s decline over the same period, according to PANews. Jamie Coutts of Real Vision contrasted relatively moderate Bitcoin funding rates and open interest with rebuilt altcoin leverage: the ratio of altcoin to Bitcoin open interest reached 1.66 on September 27, at the 98th percentile of readings since 2022.
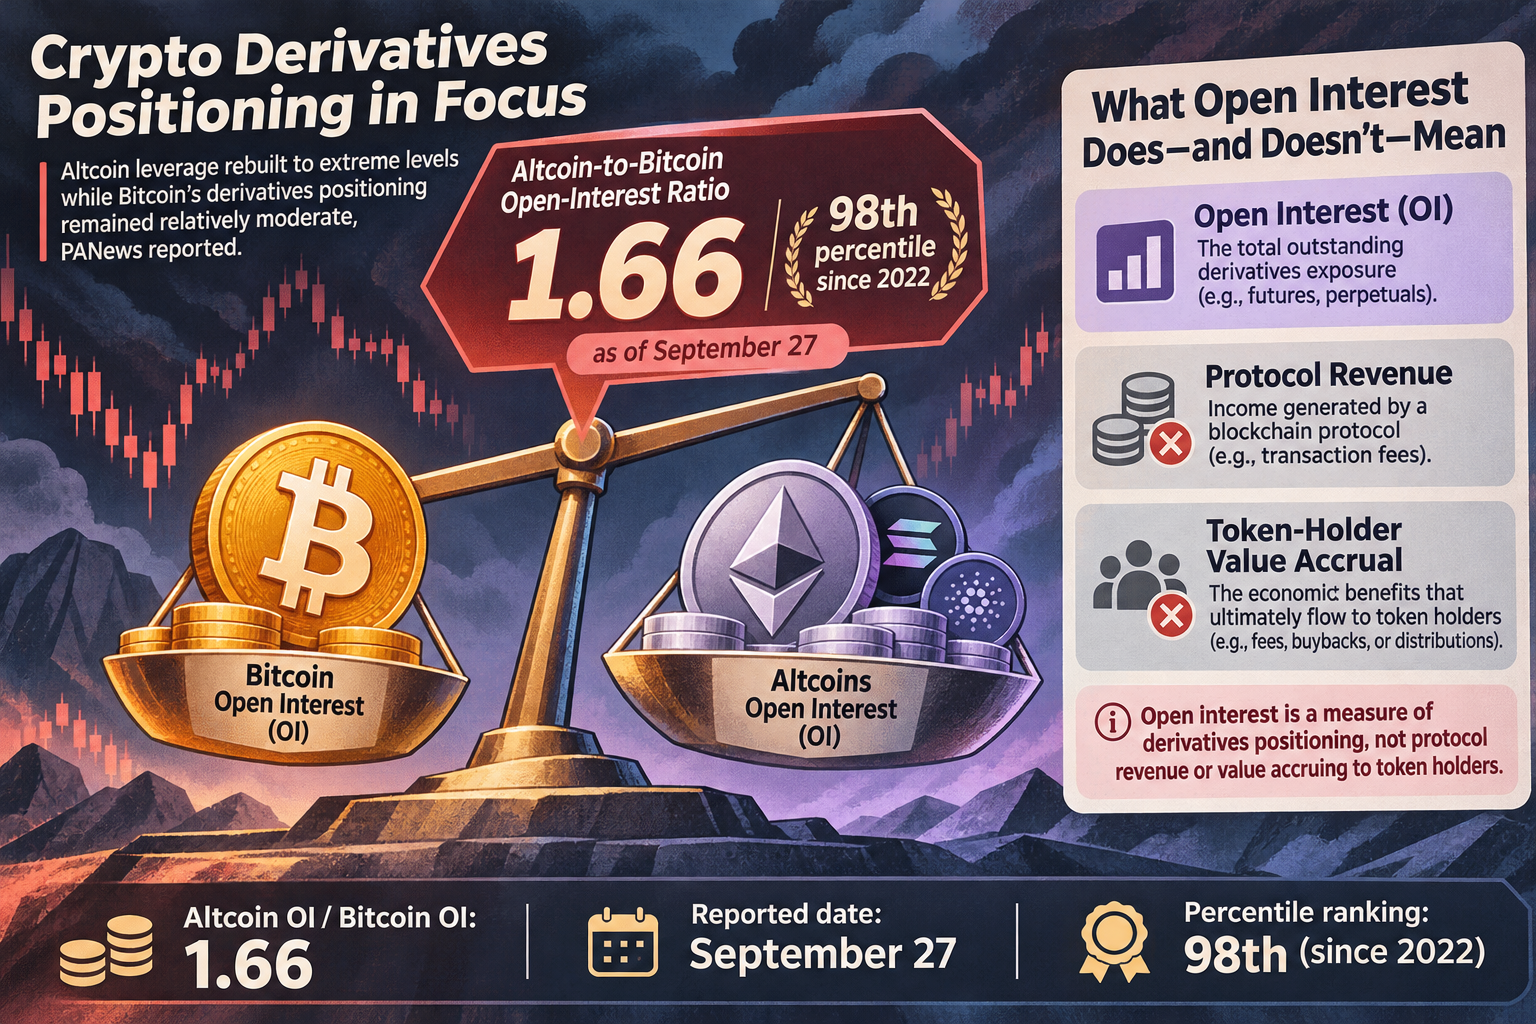
Open interest indicates outstanding derivatives exposure, not protocol revenue or value accruing to token holders. Likewise, the reported liquidity, flow and liquidation figures help explain how prices might move under stress, but supply no cash-flow inputs or valuation model from which to calculate fair value.
Source: panewslab.com (originally published 2026-11-13 16:40 UTC+8)